Advanced Usage
How to run GSEA (gene set enrichment analysis) based on result of FragPipe-Analyst?
(contributed by Quinn J Mattison, quinn-mattison@uiowa.edu)
Here we will continue our TMT tutorial (gene-level report)
- Download the DE result (a sample file is available here)
- Make sure you have R packages required to run the script (
clusterProfiler,msigdbr,enrichplot) - Write a script similar to the following one
library(clusterProfiler)
library(msigdbr)
library(enrichplot)
df <- read.csv("./Results.csv", header=TRUE)
gene_list <- df$Tumor_vs_Normal_log2.fold.change
names(gene_list) <- df$Gene.Name
gene_list <- na.omit(gene_list)
gene_list <- sort(gene_list, decreasing = TRUE)
# Get the hallmark gene set
H <- msigdbr(species = "Homo sapiens", category = "H")
H.select <- dplyr::select(H, gs_name, gene_symbol)
gsea_result <- GSEA(
geneList = gene_list,
exponent = 1,
minGSSize = 10,
maxGSSize = 500,
eps = 1e-10,
pvalueCutoff = 0.05,
pAdjustMethod = "BH",
TERM2GENE = H.select,
TERM2NAME = NA,
verbose = TRUE,
seed = FALSE,
by = "fgsea",
)
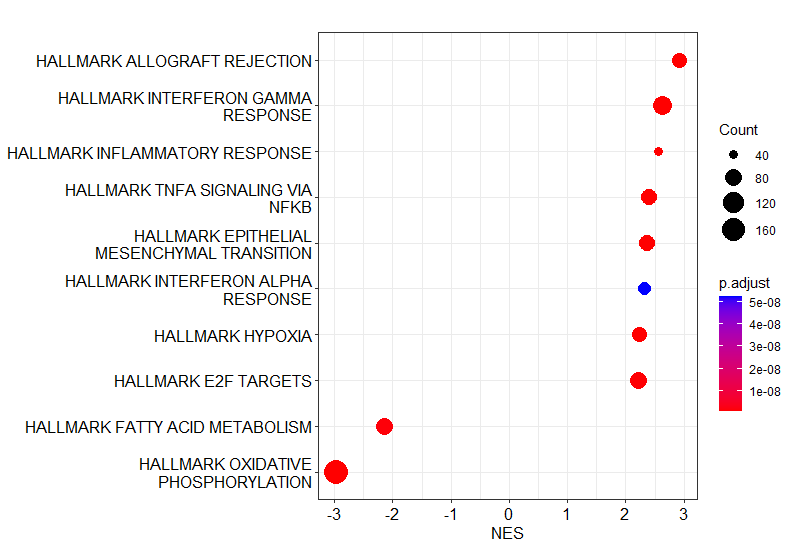
dotplot(gsea_result, x="NES", showCategory=10)
Now you should be able to get a dotplot which is similar to Figure 4B of the previous CPTAC ccRCC study.